Badger Community Data Report
Project Overview
The Alaska Department of Environmental Conservation’s (DEC) Air Monitoring and Quality Assurance program began deploying low-cost air quality sensors in communities throughout Alaska in 2023. This has allowed DEC to provide real-time air quality data to the public in more than just the communities with regulatory grade air monitoring. While the data collected from these low-cost air quality sensors does not meet rigorous regulatory requirements and should not be compared to regulatory instruments or health-based standards, the data collected by the sensors are useful for tracking real-time conditions and displaying air quality trends.
DEC currently utilizes QuantAQ Modulair sensors that measure carbon monoxide (CO), ozone (O3), nitrogen oxide (NO ), nitrogen dioxide (NO2), particulate matter (PM2.5), temperature in degrees Celsius (°C ), and relative humidity (RH). Data is collected over a minute long period and then processed into hourly and daily averages.
Sensor Overview and Results
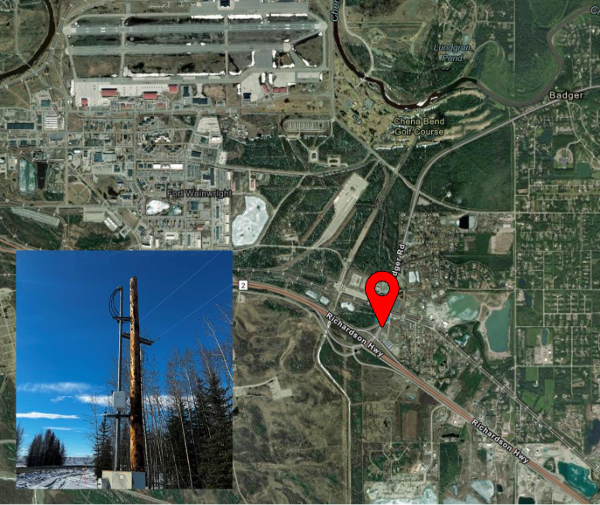
A sensor was installed in Badger at 64.810582, -147.573111 on March 22, 2024.
This data report covers air quality in Badger in Summer 2025 from April 1, 2025 to September 30, 2025.
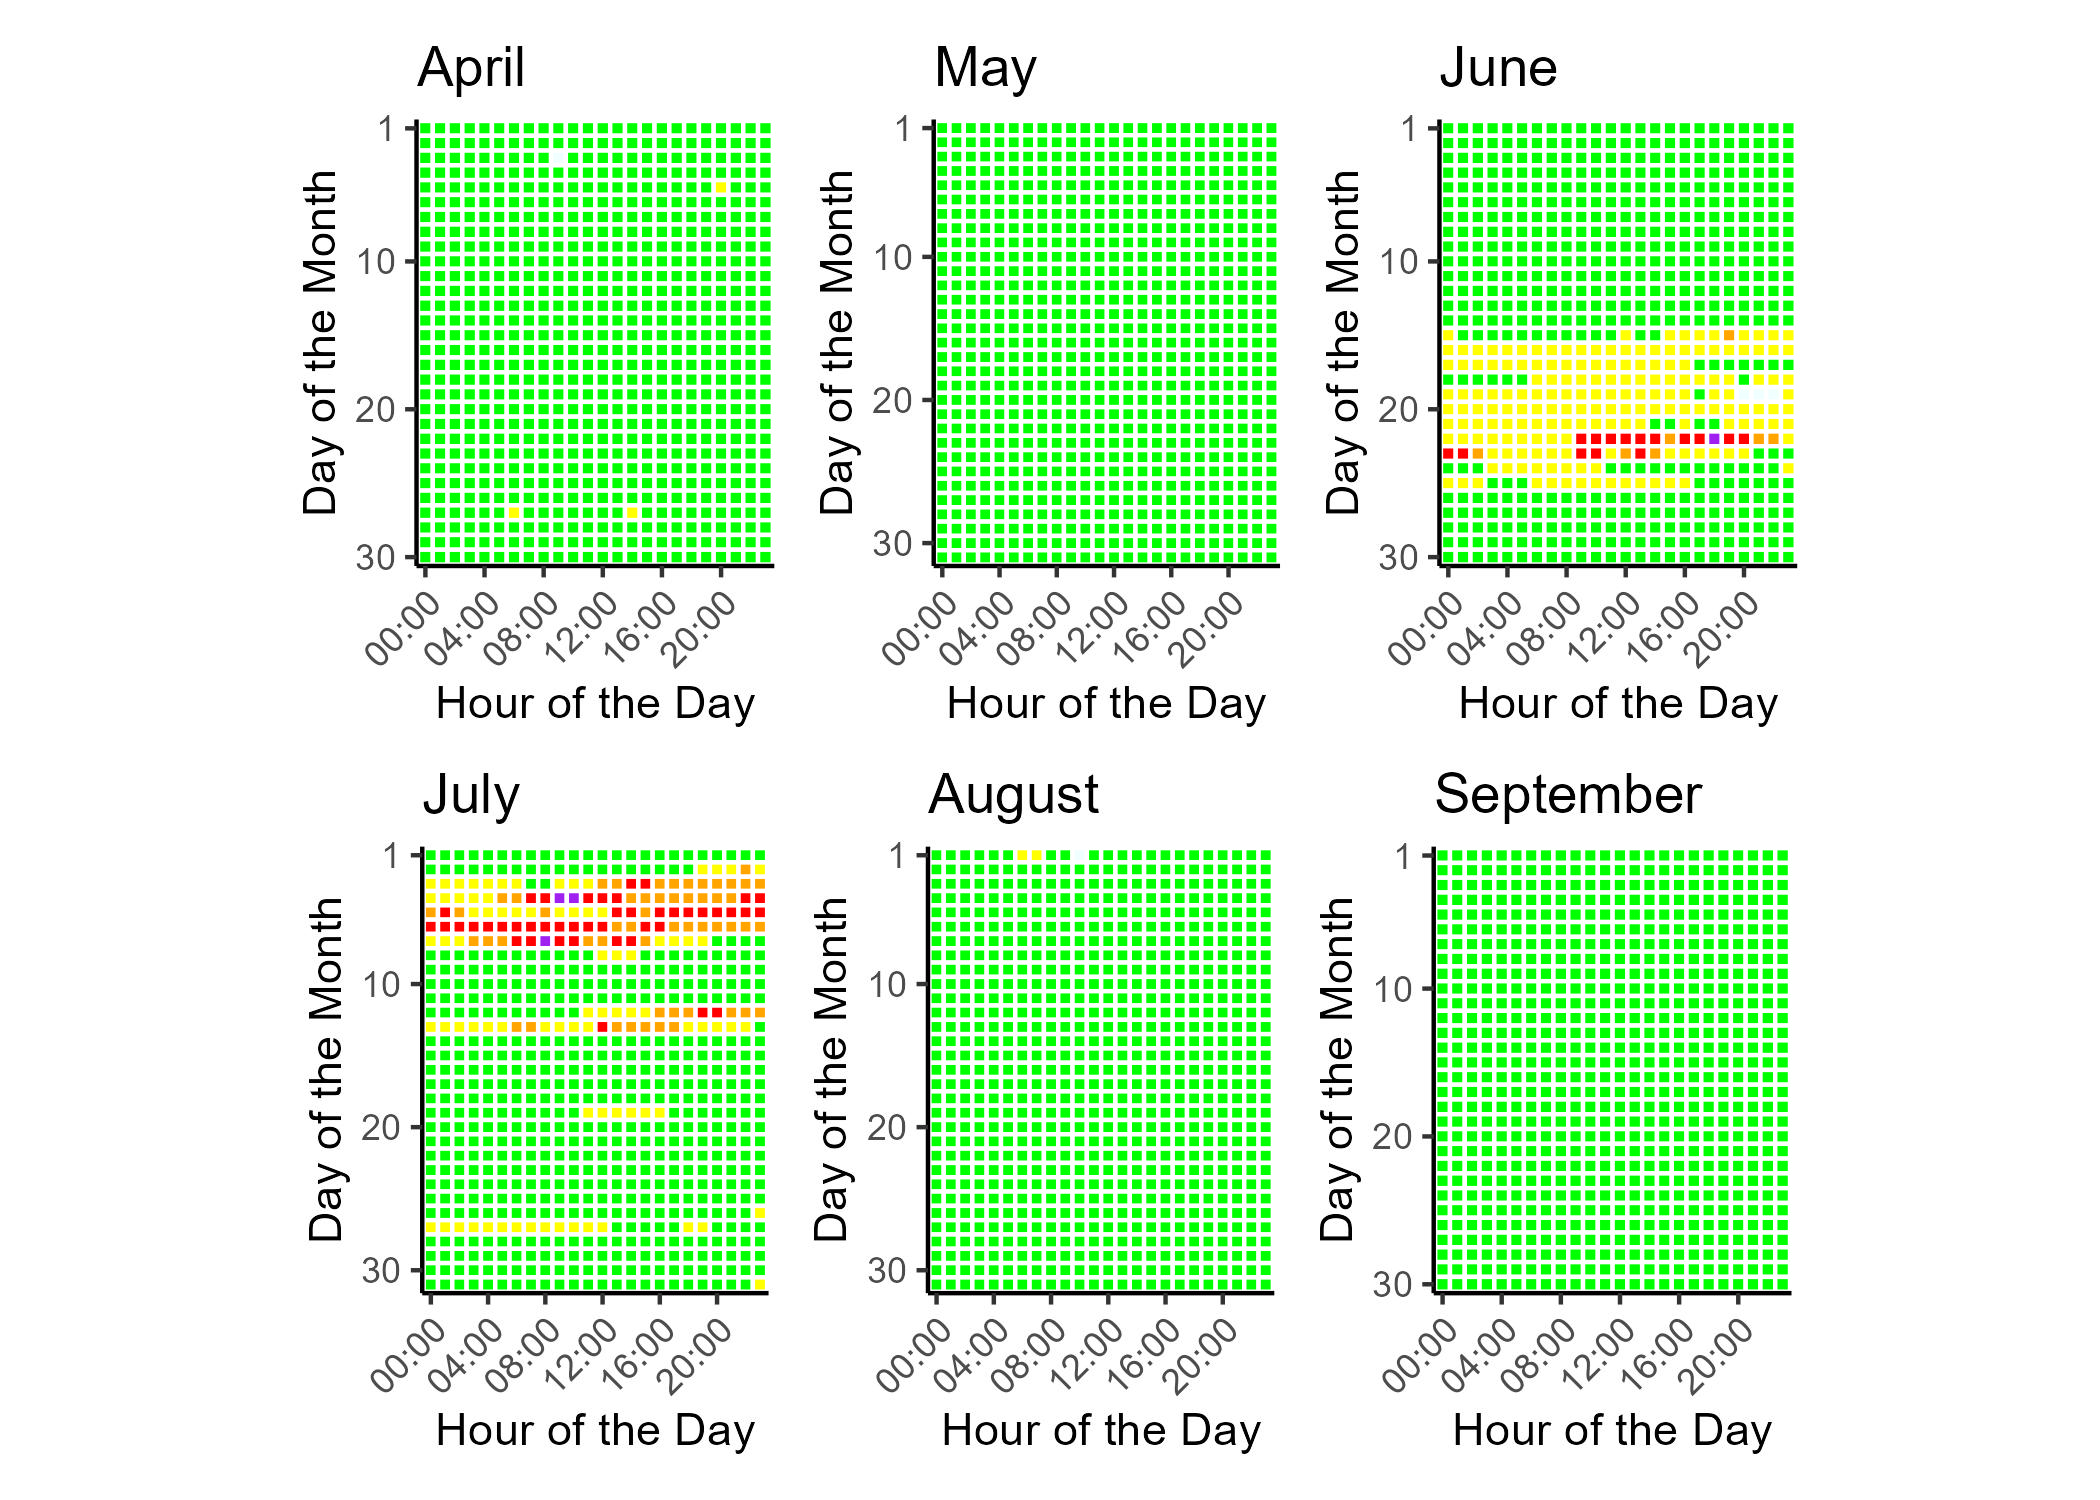
Badger’s ambient air quality for the Summer 2025 season had
-
163 days in the good air quality index (AQI) category
-
15 days in the moderate AQI
-
2 days in the unhealthy for sensitive groups AQI
-
3 days in the unhealthy AQI
-
0 days in the very unhealthy AQI
-
0 days in the hazardous AQI
Sensor Performance
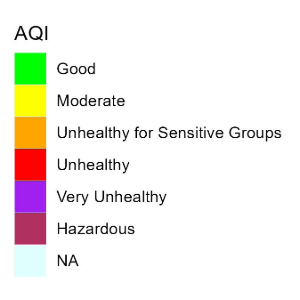
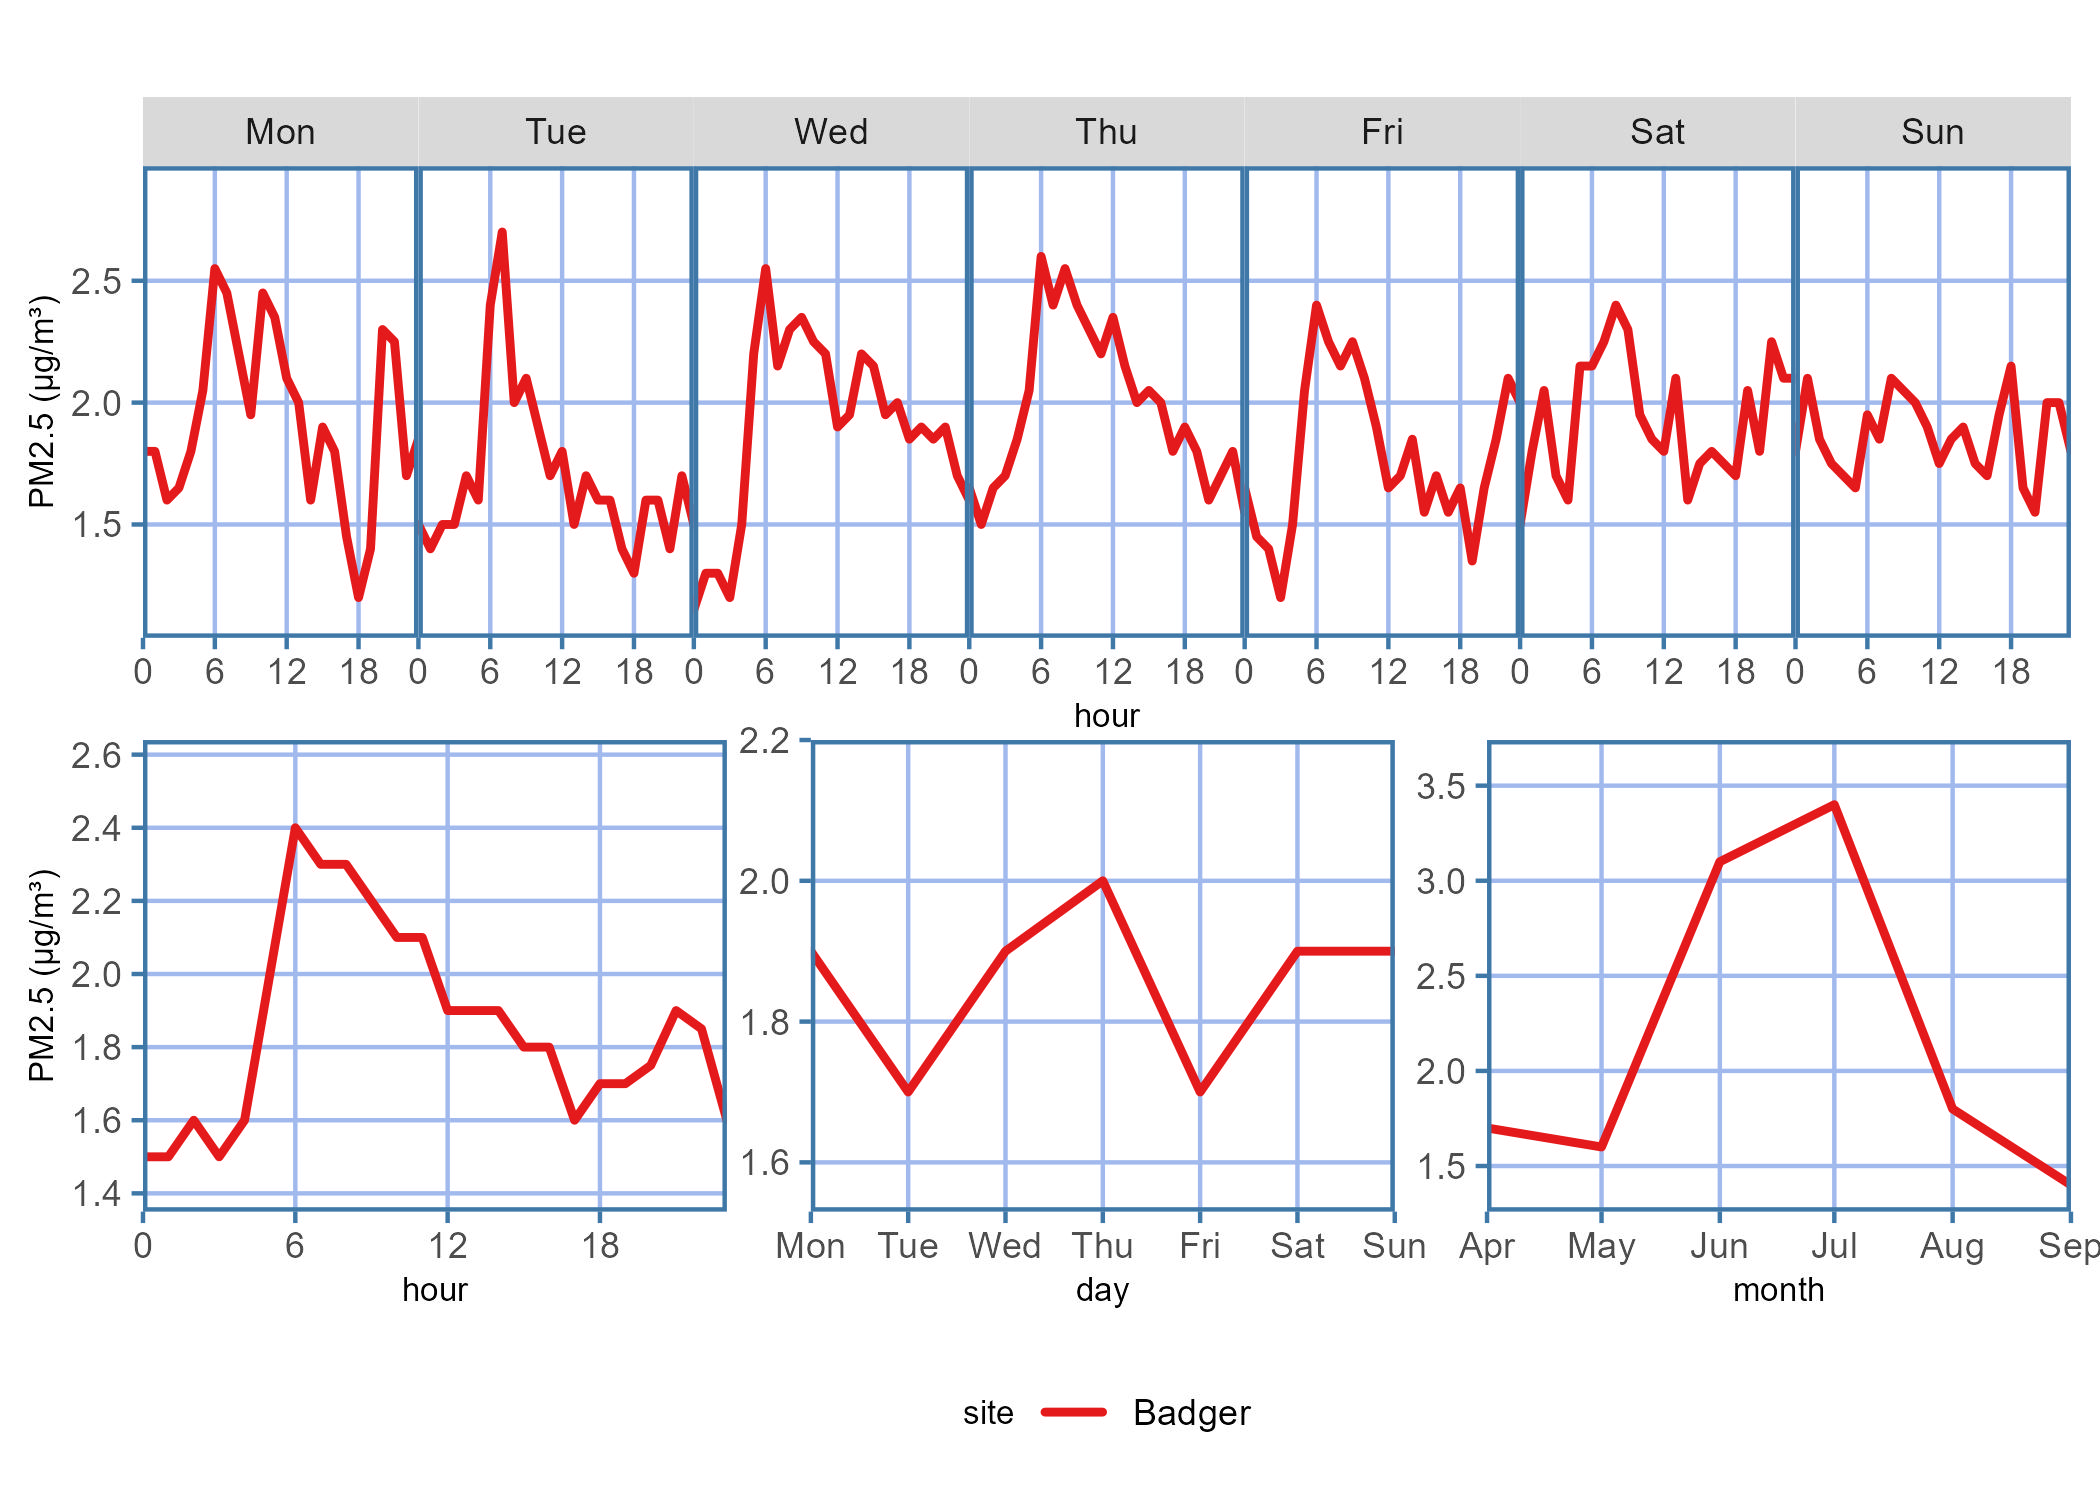
Badger’s PM2.5 ambient air quality for the summer 2025 season fell mostly in the Good range of the Air Quality Index (AQI; more information about AQI is provided in Resources) with notable periods of Moderate to Very Unhealthy AQI in June and July due to wildfires across interior Alaska. Diurnal patterns show slight increases of median PM2.5 concentrations in the evening compared to during the day, with June and July both experiencing higher median concentrations than other summer months.
Hourly PM2.5 Air Quality Index (AQI) for Summer 2025
Median PM2.5 Concentrations for Summer 2025
Summary Statistics of Air Pollutants
| Statistic | 1-hour PM2.5 (µg/m3) | 24-hour PM2.5 (µg/m3) | 1-hour PM10 (µg/m3) | 24-hour PM10 (µg/m3) | O3 (ppb) | NO2 (ppb) | NO (ppb) | CO (ppm) |
|---|---|---|---|---|---|---|---|---|
| Minimum | 0 | 0.1 | 0 | 4 | 0.2 | 2.48 | 0.61 | 0.2 |
| Mean | 4.8 | 4.8 | 22.9 | 22.9 | 23.58 | 16.23 | 3.28 | 0.72 |
| 1st Max | 159.4 | 69.1 | 942.2 | 116.7 | 56.6 | 35.76 | 60.46 | 3.1 |
| 2nd Max | 149.1 | 69.1 | 879.5 | 88.3 | 55.7 | 35.07 | 54.57 | 3.1 |
Data Disclaimers
*These statistics are based on preliminary data readings and are intended to provide a brief overview of sensor activity. Finalized data may be obtained upon request and through our annual statistical reports. Data from the community sensor network in non-regulatory and not comparable to the EPA’s National Ambient Air Quality Standards (NAAQS).
**PM10 particle sensors are influenced by weather events such as fog and snow due to hygroscopic effects, essentially water particles are counted as PM10, creating false maximum values that do not necessarily pose health risks.
Resources
Data Access
To access historical data for your community’s sensor, please email a request to AMQA-Data-Requests@alaska.gov. Data will be provided in Excel or .csv format.
Questions or Comments?
Please contact us!
Isaac Van Flein (Fairbanks): 907-451-2253 / Isaac.VanFlein@alaska.gov
Ayla Crosby (Anchorage): 907-269-7750 / Ayla.Crosby@alaska.gov
 Indicates an external site.